# Space Pool LP Returns
# Return Scenario Analysis Summary
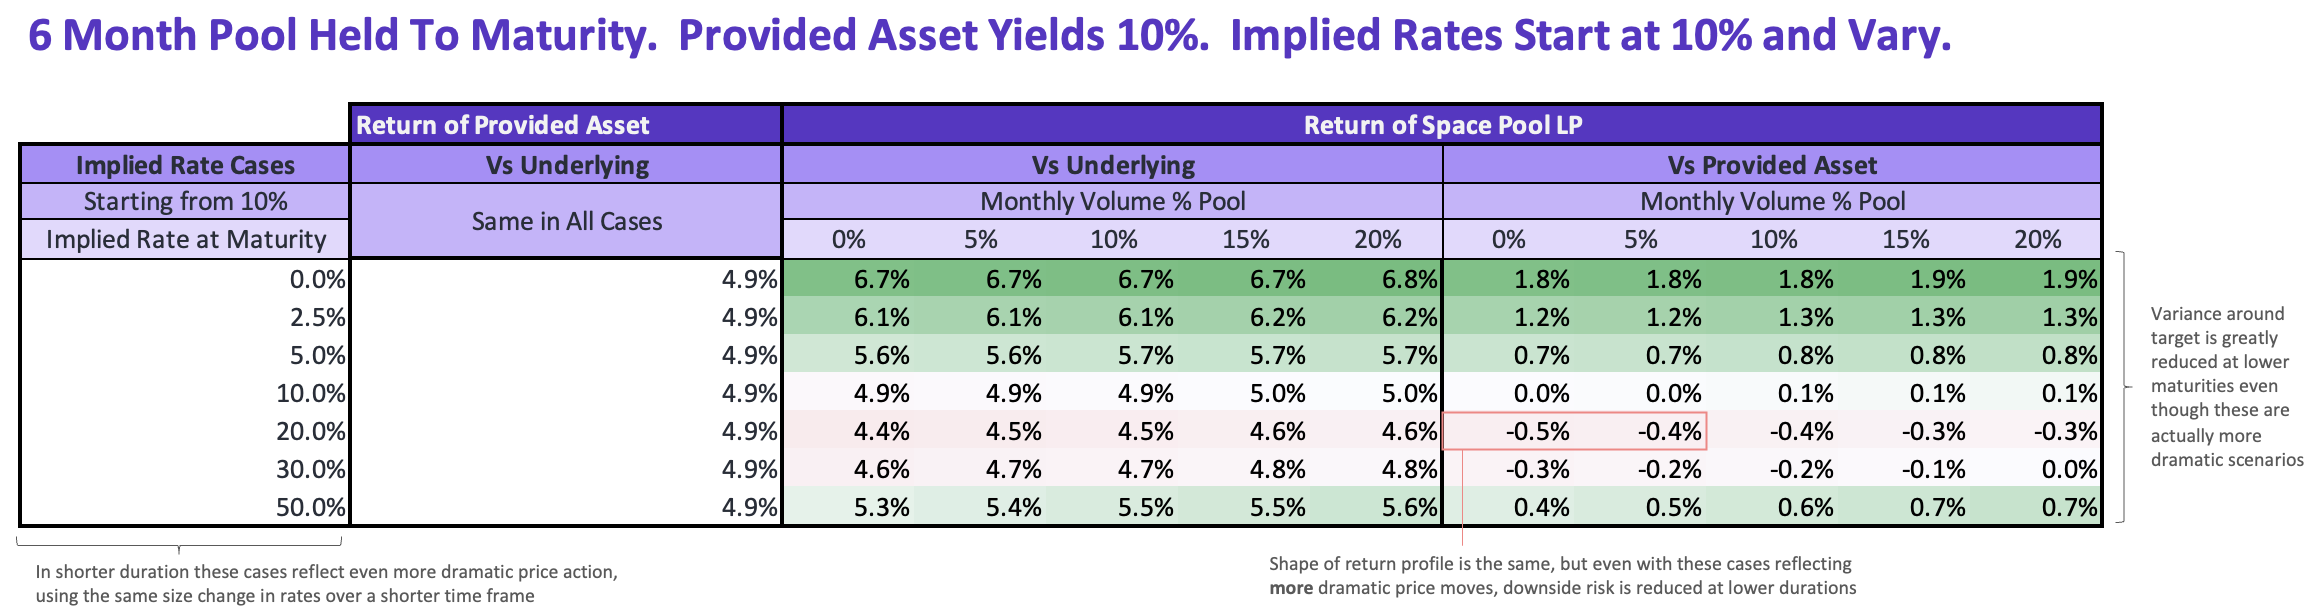
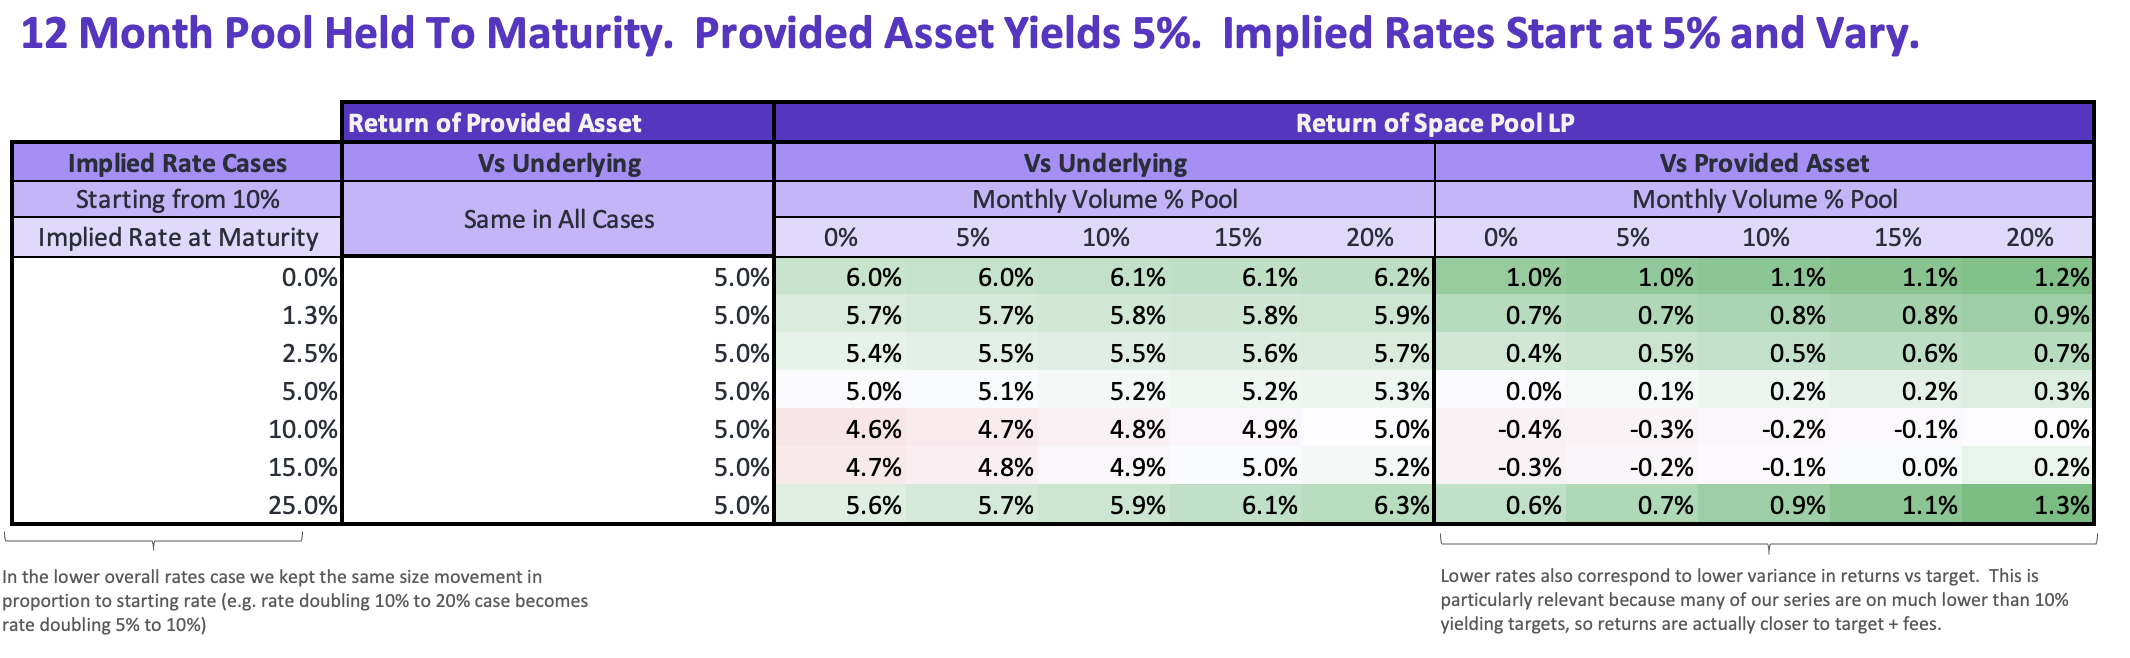
Below we break down a scenario analysis of holding an LP position in a Space Pool for a 1 year series from inception to maturity. Note that the pool outperforms the provided yield-bearing asset asset in most scenarios. Read on to understand why.
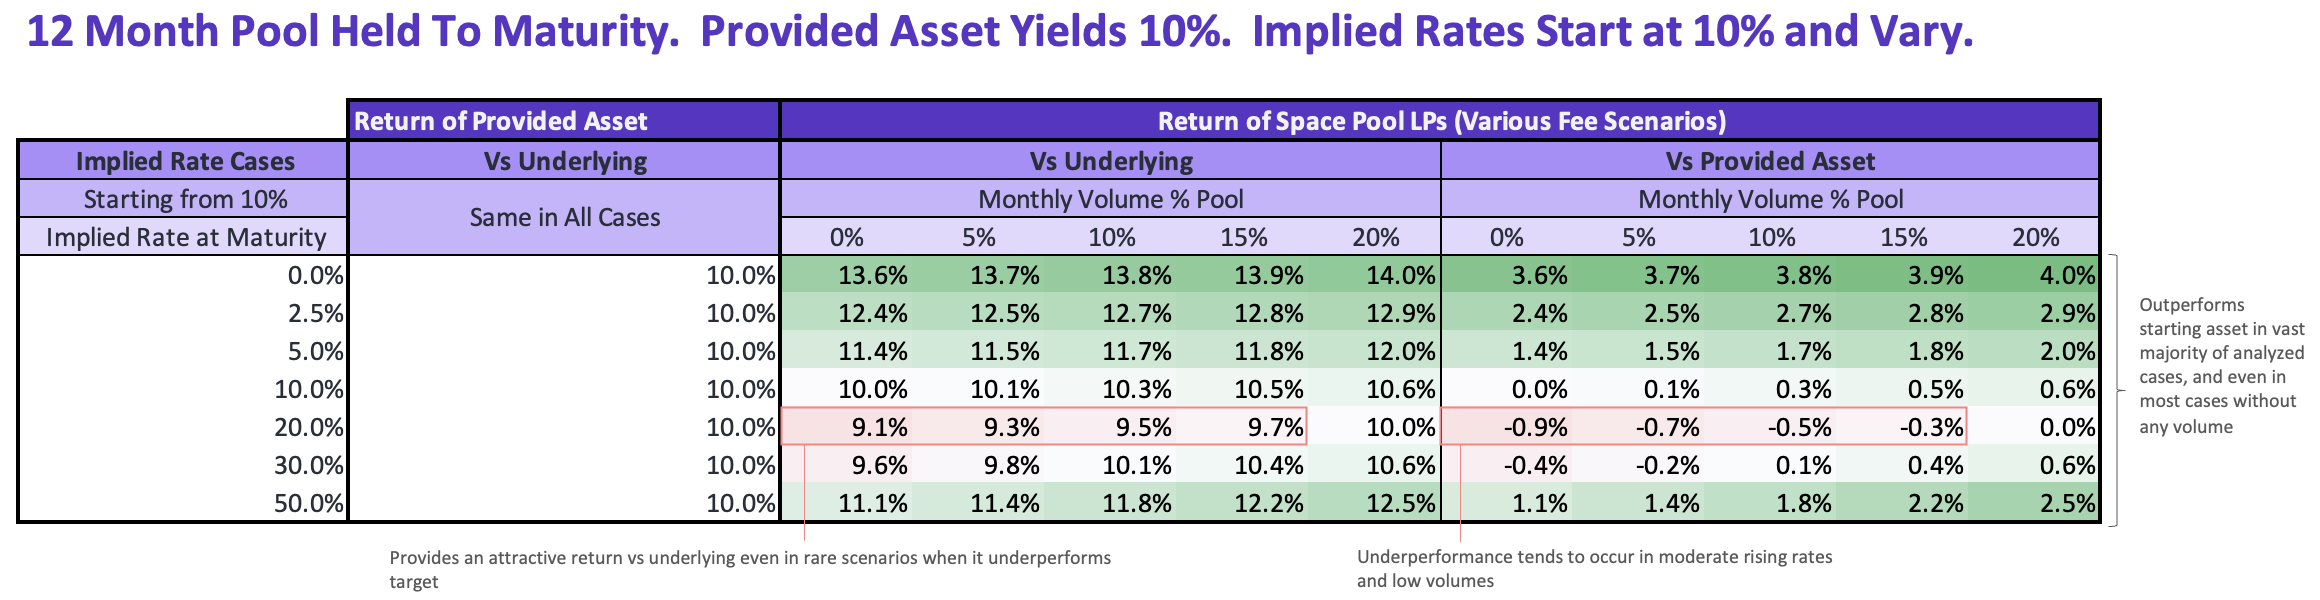
In the analysis we cross-examined the returns in 7 different fixed rate price change scenarios and 5 different volume scenarios, then compared those returns both to a non-yielding underlying and the variable yielding starting asset (called "Target"), which we assume continued yielding at its starting rate. In the analysis, each case starts with the fixed rate at the same rate as the provided yield-bearing asset and linearly approaches another value at maturity.
Note: This document is an analysis of hypothetical cases used to illustrate some of the important dynamics that impact Space Pool LP returns. This is not a comprehensive description of the risks and rewards associated with Space Pool LP shares.
The table uses the returns of holding the LP share until maturity, but an LP is able to exit the pool at any time.
# What is a Space Pool LP Position?
A Space Pool LP enters with a variable yield-bearing asset (“Target”), and then the pool breaks some of that asset down into two separate claims (a “YT” and a “PT”). The Space AMM allows trading between those PTs and the target, and the LP keeps the YTs as a hedge for the duration risk the PTs would otherwise introduce. The discount at which PTs trade to Underlying in this pool creates an "Implied Rate," the annualized fixed rate a PT buyer would get by purchasing as the current price and holding to maturity (since a PT becomes redeemable for 1 Underlying worth of Target at maturity).
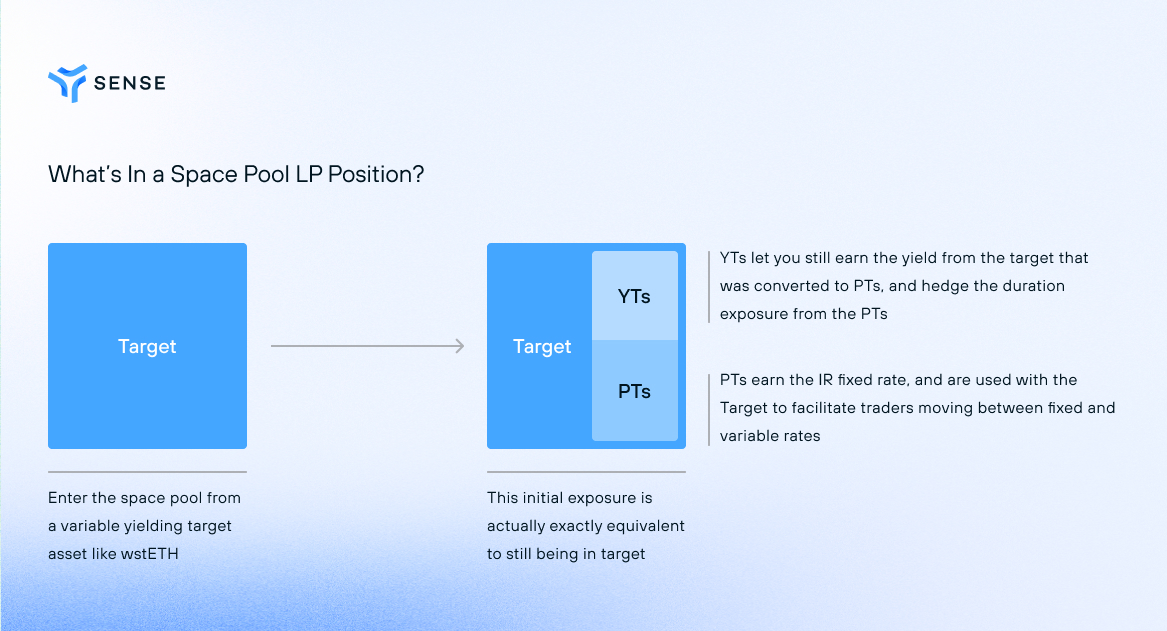
Note: if you join the pool after inception, you can inherit excess PTs or YTs from previous implied rate price activity, This means that when entering a pool outside of the cooldown period, you don’t have an exposure exactly equivalent to target because that excess carries some duration exposure.
# What Drives Space Pool LP Returns?
LP returns have three drivers.
(1) Blended Variable and Fixed Yield
(2) Duration Risk
(3) Fees
# Blended Variable and Fixed Yield
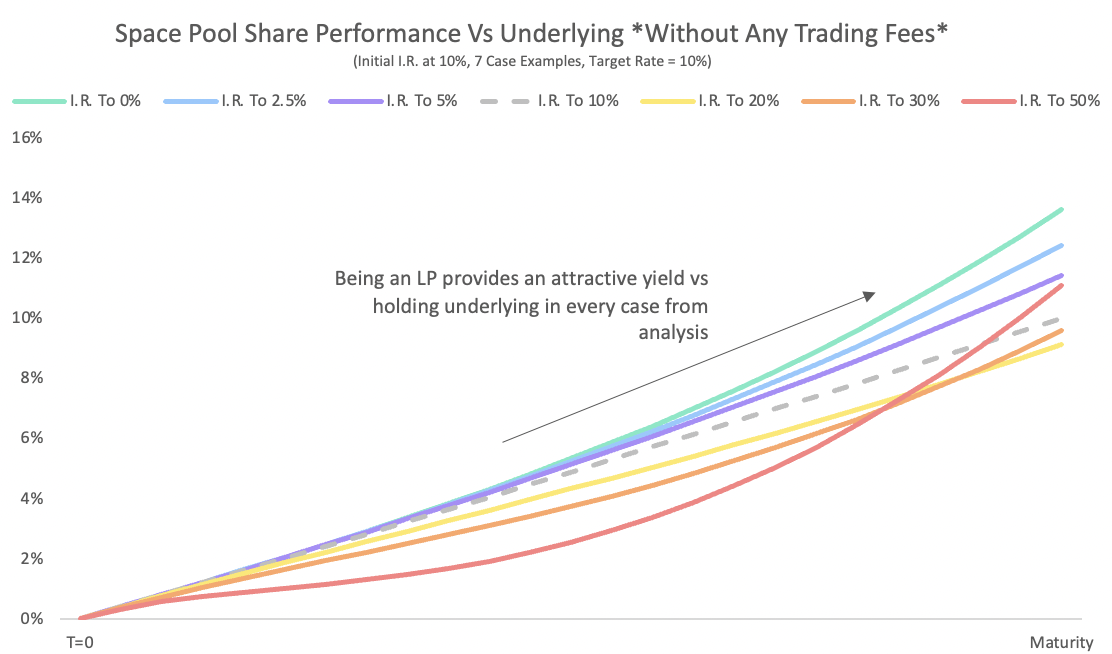
The Space Pool LP is earning variable yield accrual on YTs, variable yield accrual on target, and fixed yield accrual on PTs at all times, regardless of trading activity. This is why a Space Pool LP outperforms the underlying (non-yield-bearing asset) in every case contained in our analysis (it is not theoretically impossible to underperform underlying, but it would take market scenarios that fall outside of this analysis -- e.g. if the implied rate and target rate both dropped to zero right at the start of a series, duration risk could create some loss that the augmented exposure to the variable rate fails to make up by maturity).
When fixed rates rise, it means that traders are selling PTs into the Space Pool, which concentrates the LP's exposure to these higher rates. Conversely, when fixed rates fall, the LP is increasing their concentration of their exposure to the variable rate. In short, the price movements that create a drag through duration exposure (described below) also often increase the yield the LP is earning, which offsets that drag on returns.
# Duration Risk
There is no duration exposure when an LP enters the pool at inception because their PTs and YTs have equal and opposite duration exposure. Trading between PTs and target, however, changes the PT balance in the pool, while the LP's YT position stays the same. This means the LP may have more PTs than YTs (or vice versa) at some point in the pool's lifetime, and those "excess" PTs or YTs can create some duration risk. The duration drag from falling rates is usually much smaller than the duration drag from rising rates (excess YTs comprise a very small portion of overall exposure unless in an extremely long dated pool with extremely high yields). At the kinds of durations that series actually exist at, the more meaningful downside of duration risk usually occurs when fixed rates rise, increasing the PT balance and adding duration risk. Offsetting this, though, is the fact that the growing number of PTs in the pool in that case also earn that higher rate.
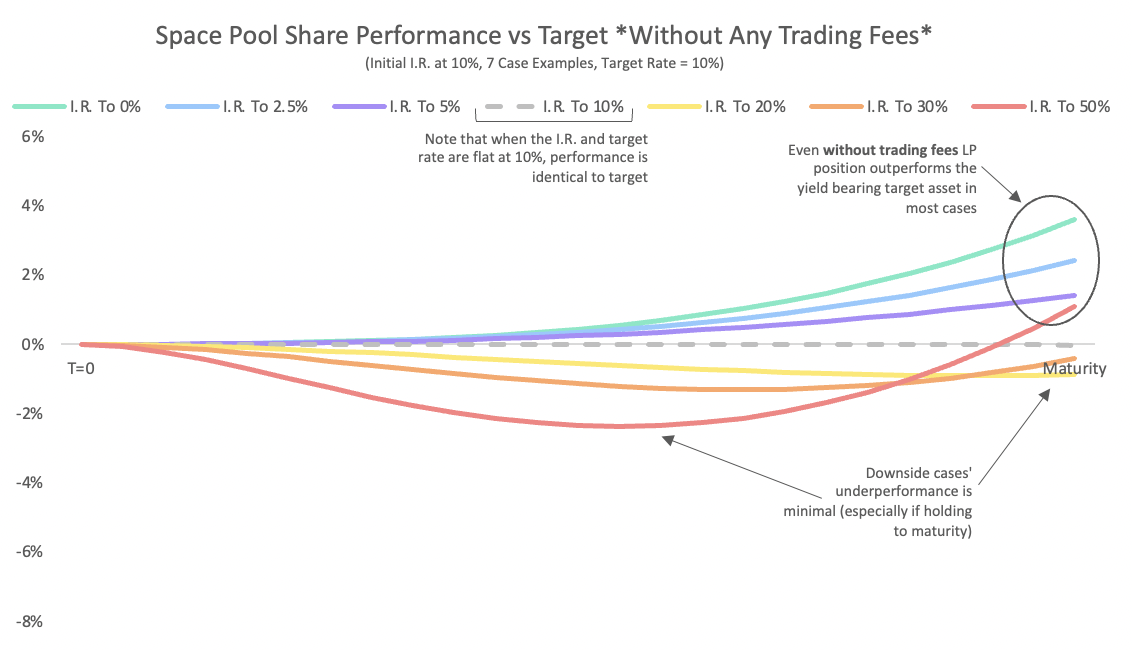
This offsetting force is why LPs can have an attractive return profile vs staying in the provided yield-bearing asset, even when there are no fees. The pool can outperform the starting asset in both falling rate environments, and also in extreme rising rate environments. When rates stay the same all around, the pool is identical to the starting asset. The only underperformance within our analysis happens when rates rise enough to create a drag on returns through duration risk, but not enough for the high yielding PTs traders have sold into the pool to earn it back by the time the pool reaches maturity. But, once we include fees, even that slight underperformance becomes less likely.
# Fees
Rather than charging fees on volume alone, the Space Pool charges a fee from traders that is equal to Volume * PT Discount * 5%. As an example, someone buying PTs from this analyzed pool at the start would pay Volume * 10% * 5% = 0.50%, because the starting implied rate is 5% annualized, PT prices are 0.95 underlying (a 5% discount). This fee structure was initially conceived in order to make sure fees don’t eat too far into PT buyer’s fixed yield at low rates, but it has a favorable effect on LP returns. The charts below show through time performance of some of the different volume and interest rate cases from the initial table, demonstrating the dynamics we’ve described.
Space Pool Performance VS Provided Variable Yielding Asset in 3 Price Action Scenarios
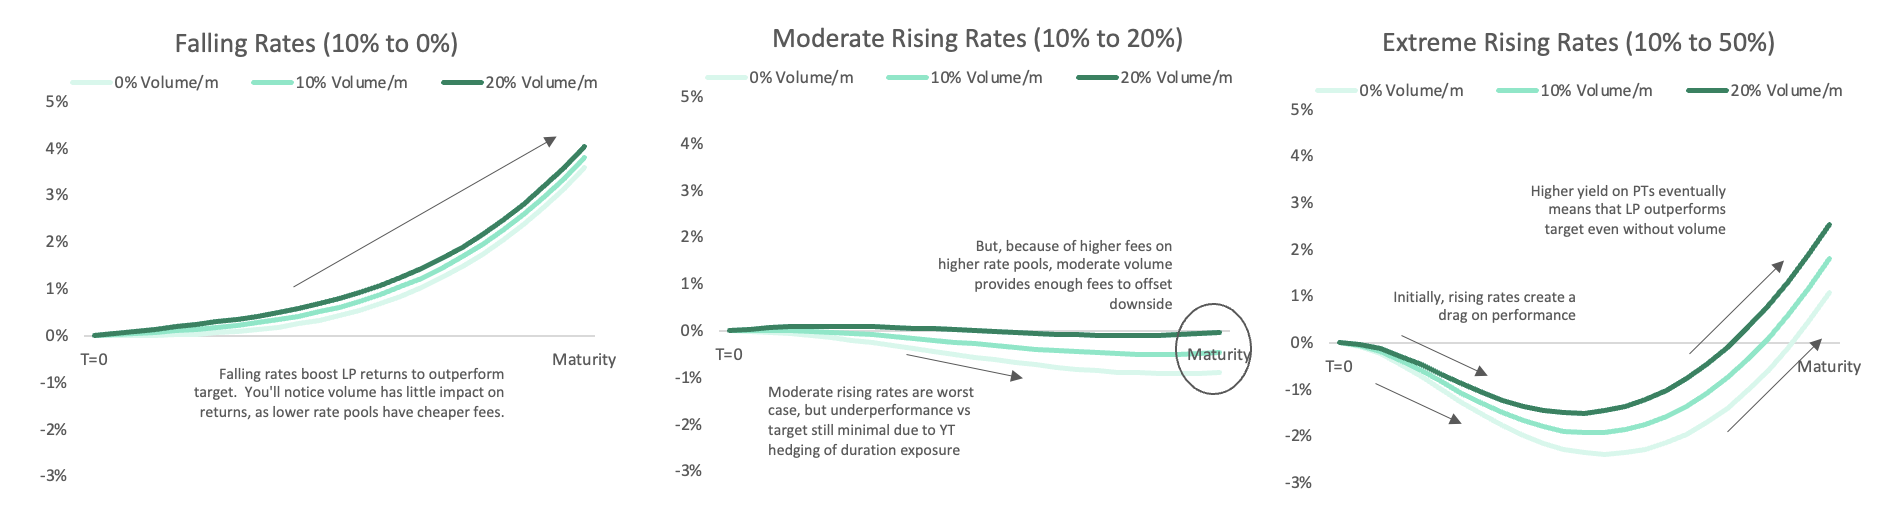
These charts show LP performance in 3 cases of rate price action, with 3 volume scenarios for each for a 1 year pool starting at a 10% implied rate. Performance is shown vs alternative of holding target asset, with target asset yield held constant at 10%.
You’ll notice that the positive impact from fees is higher in the second scenario than the first, even at the same amount of volume. As we mentioned above, the scenarios where LPs can underperform target are where fixed rates rise a moderate amount. The structure of fees for the pool helps offset this downside because higher fixed rates (all else equal) mean higher fees.
# Shorter Duration Series Are Less Sensitive to Price Action
At lower durations, volatility of returns around the provided yield-bearing asset is reduced due to less duration exposure. Consequently, as series get shorter, they approach the ideal LP return of Sense Space: “Provided Yield-Bearing Asset + Fees”.
Below you can see an example of a medium duration 6mo series. Bear in mind, these cases use the same ending rate as the example case above, so the implied rate volatility reflected in these return profiles is actually much greater: for example, an implied rate change from 10% to 50% over 6 months instead of 12 months.
Here is the return profile of a 6 month series LP performance vs the target asset (with the same target asset used in the initial example and including no fee yield).
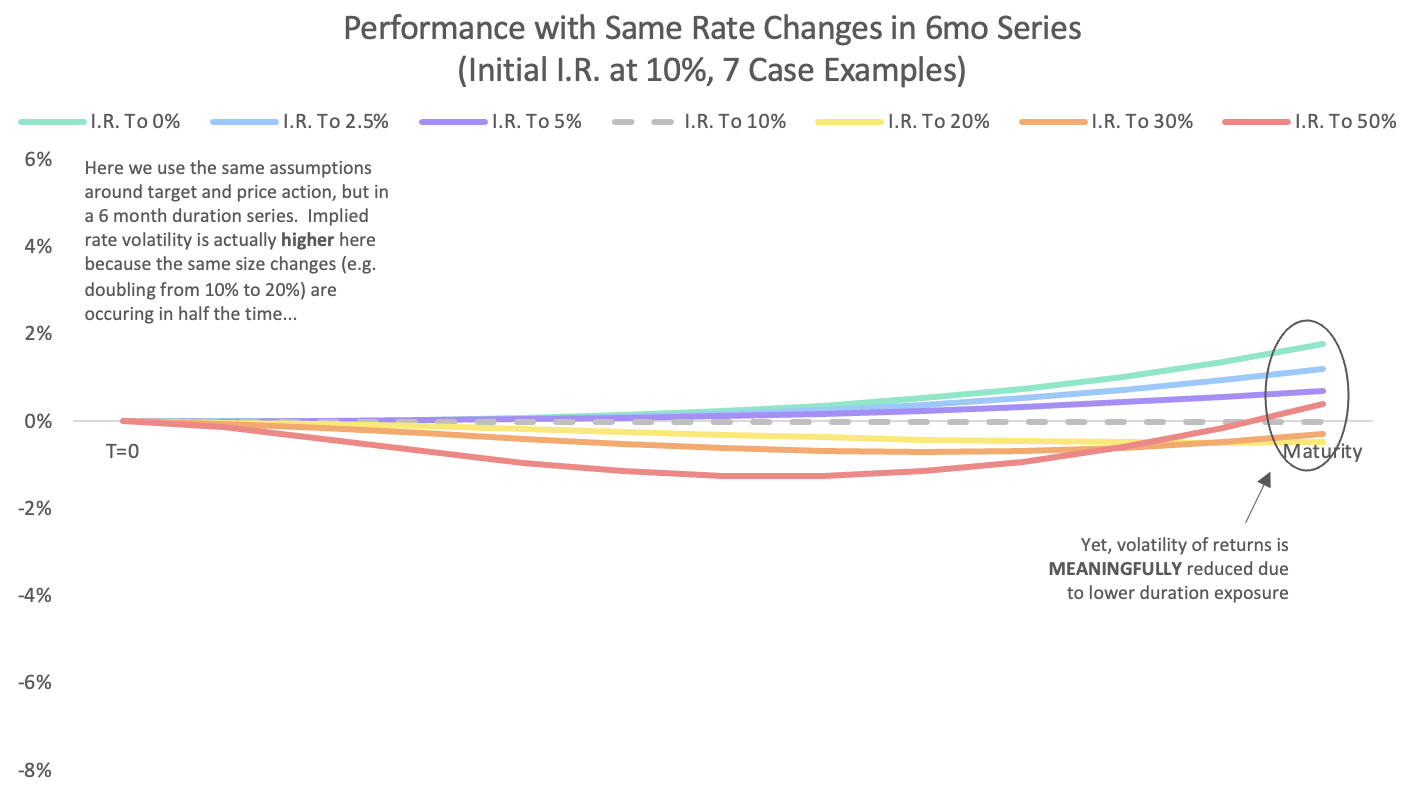
And, as with the first case, here is what the outcomes are in various volume scenarios. There is significantly less variance in returns vs the provided asset, even in these faster implied rate price changes. You'll also notice that the impact of fees is smaller along with the overall much tighter cone of outcomes, this is because the size of the fee is sensitive to duration as well as implied rate level (and, of course, this is only 6 months of fees at a given monthly volume instead of 1 year).
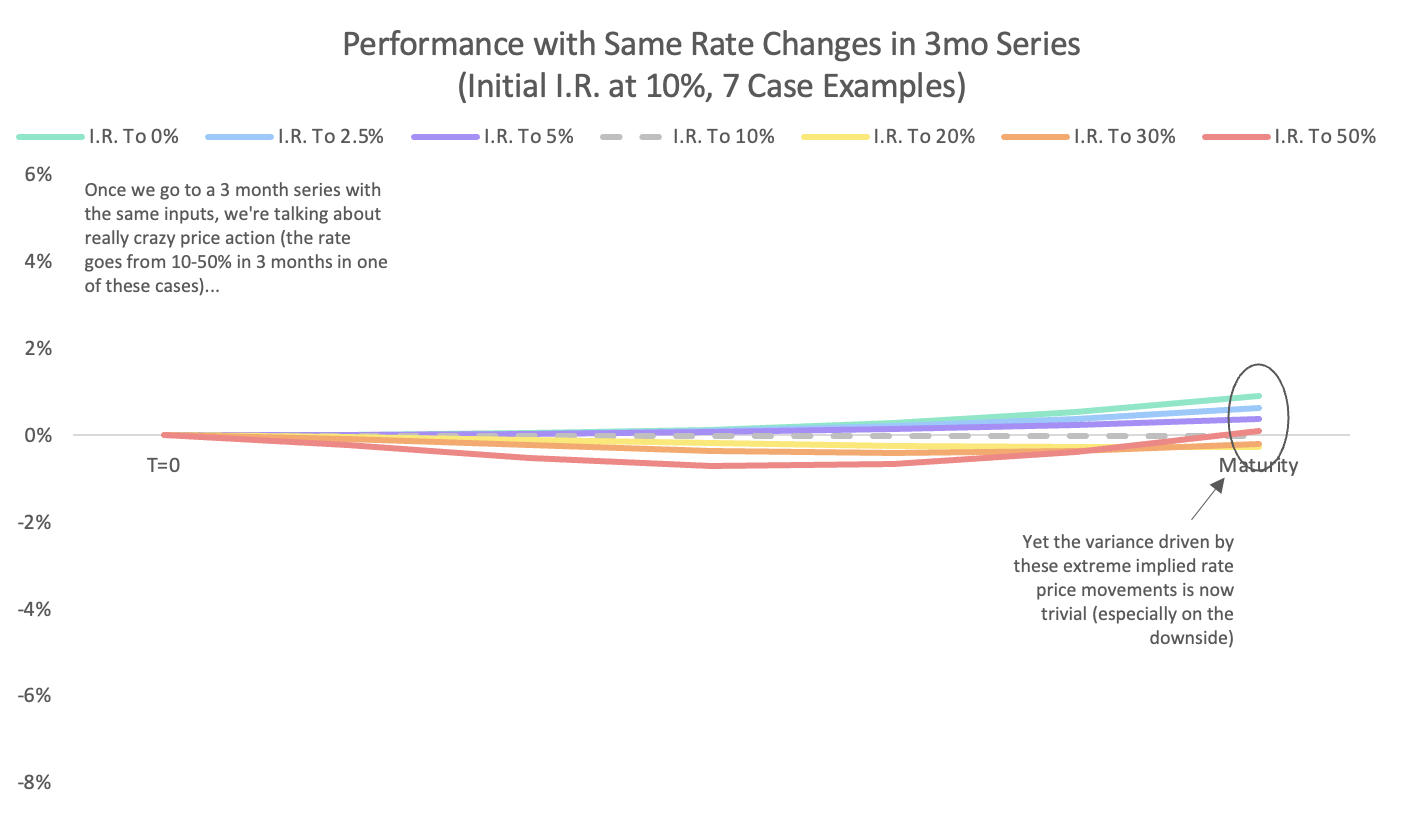
Once you get into short duration series like the 3 month series in the chart below (shown without trading fees), even extreme implied rate action has only a minor effect on your return profile. Remember, the cases below have even more volatile price action than the original: Rates are going from 10%->0% or 10%->50% in 3 months instead of 12 months.
# Lower Yielding Series Are Less Sensitive to Relative Interest Rate Changes
Even if you are staying in a long duration series, assets with lower target rates and lower implied rates will generally be less sensitive to equivalent proportional moves in the implied rate. See below the performance of a 12 month duration Space Pool position for a 5% yielding target asset and an Implied Rate starting at 5%. For the cases in this example, we used the same proportional change (e.g. instead of doubling from 10-20% the same case doubles from 5-10%)
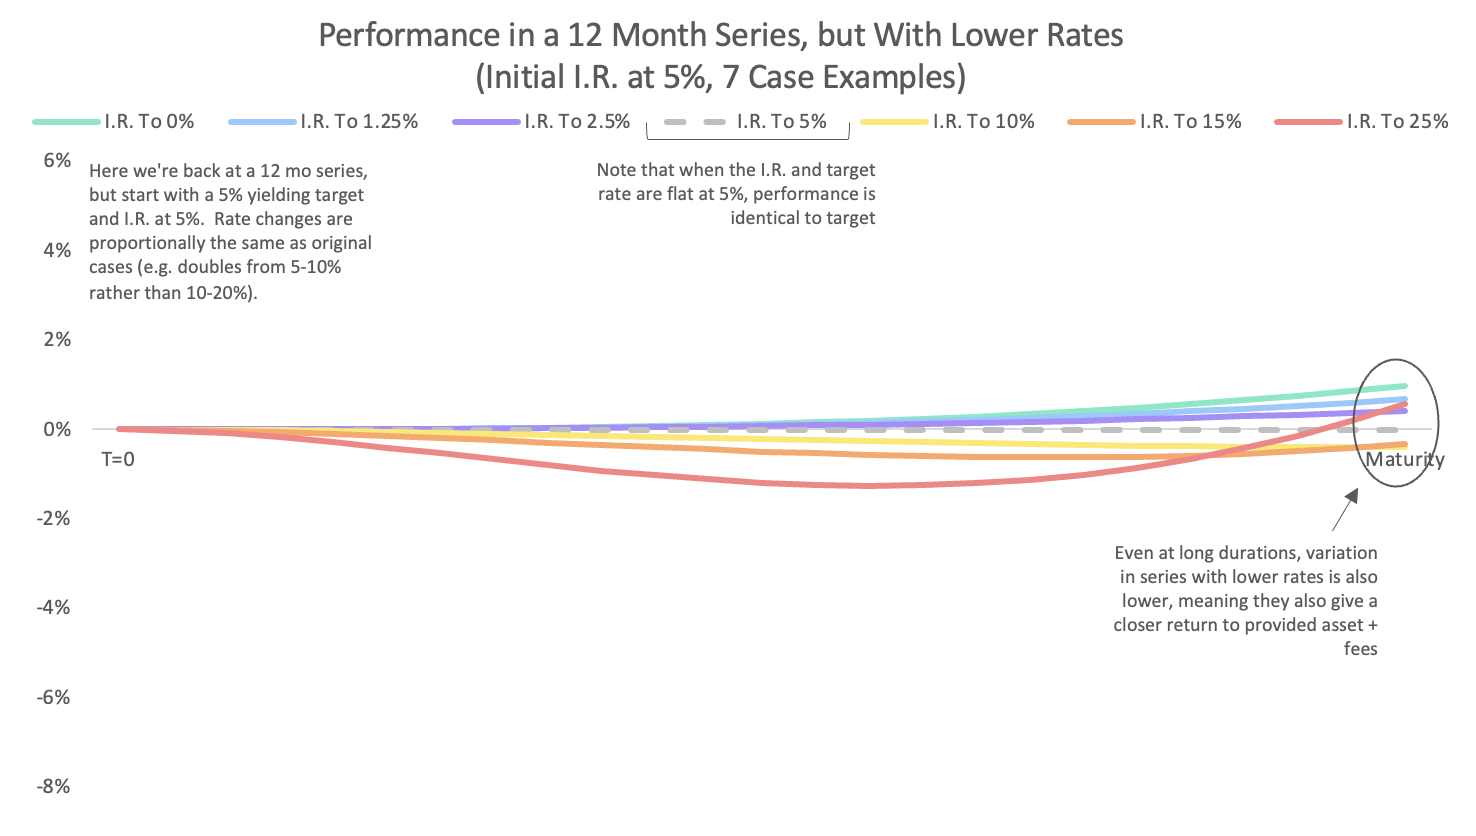
The less important implied rates are as a drive of returns, the closer the return profile is to "Provided Yield-Bearing Asset + Fees."
# Disclaimer
Disclaimer: This post is for general information purposes only. It does not constitute investment advice or a recommendation or solicitation to buy or sell any investment and should not be used in the evaluation of the merits of making any investment decision. It should not be relied upon for accounting, legal or tax advice or investment recommendations. This post reflects the current opinions of the authors and is not made on behalf of Sense Finance or its affiliates and does not necessarily reflect the opinions of Sense Finance, its affiliates or individuals associated with Sense Finance. The opinions reflected herein are subject to change without being updated.